Introduction
Despites its small fraction of the total amount of water on Earth, less than 1%, terrestrial water has a crucial impact on life and the human environment. Among the various reservoirs in which fresh water is stored on land (e.g., ice caps, glaciers, snow pack, soil moisture, groundwater), surface waters comprised of rivers, lakes, reservoirs, wetlands, and episodically inundated areas, play a crucial role in the global biochemical and hydrological cycles with significant influence on the climate variability.
From a hydrological point-of-view, analysis of the flow, spatial distribution, and storage of fresh water on land is a key issue for understanding the terrestrial branch of the global water cycle. For instance, river discharge represents one of the principal drivers of the ocean freshwater budget and contributes significantly to the variability of the sea surface temperature and salinity. Floodplain inundations are also critical for understanding the hydrological processes as a regulator of river hydrology owing to storage effects along channel reaches.
From a biogeochemical point-of-view, wetlands and inundation events have a major impact on methane production, carbon storage/release, denitrification, and sulphur cycles. They are the world's dominant natural source of methane (CH4) and the only one dominated by climate variations. Approximately 20 40% of the worlds total annual methane emission to the atmosphere comes from natural wetlands and irrigated (seasonally flooded) rice fields; hence the fluctuations in wetlands and inundation extents are key contributors to inter-annual variability in methane surface emissions.
Surface fresh water is also part of the management of water resources used by people. One of the biggest challenges in the 21st century will be managing water availability and related global health and hazard prevention aspects. Over 2 billion people worldwide are already suffering from inadequate drinking water supplies so population growth by 2025 is expected to impact water availability even more than climate warming.
With approximately 60% of the worlds floodplains and wetlands inundated during some portions of the year, our current knowledge of the spatial extent and variability of the land surface water cycle at the regional-to-global scales is still rather incomplete.
Our current knowledge of the spatio-temporal variations of continental waters relies on sparse in situ gauge measurements and partially verified hydrological models. In situ gauge measurements help quantify the movement of water (discharge) at a few points along river channels but provide comparatively little information about the spatial dynamics of surface water extent in floodplains and wetlands. In addition, the availability of ground-based gauge information has dramatically decreased during the last decade, especially in remote areas like the Arctic or inaccessible tropical regions. For instance, the area centered on Manaus in the central Amazon basin includes about only 10 gauges, and the Rio Negro with its 40,000 m3/s annual average flow is almost completely ungauged. Even in places where stream gauges exist, legal and institutional restrictions often make the data unavailable for scientific purposes. Lacking spatially complete measurements of inundation/wetland locations, sizes, and water storage, hydrologic models are unable to properly partition precipitation among these several components and represent their effects on river discharge at continental-to-global scales. Errors can exceed 100% because inundated surfaces modulate runoff by temporarily storing and changing runoff and evaporation. Imperfect models also limit the possibilities to predict changes in the hydrology system under a warming climate. Our ability to measure, monitor, and forecast supplies of fresh water using in situ methods and hydrological models is facing considerable difficulties, at least at global and continental scales.
Over the last fifteen years, satellite remote sensing techniques have been very useful for large-scale hydrology investigations as they provide a unique means to observe large regions continuously and are the only alternative to in situ data in remote areas. Recent advances in remote sensing hydrology have demonstrated that some hydraulic variables can be measured reliably from satellites. For example, satellite altimetry (Topex/Poseidon, Jason-1, ERS and ENVISAT missions) has been used for systematic monitoring of water levels of large rivers, lakes and floodplains, now providing about 15-year long time series. Since 2002, the GRACE gravity mission provides direct estimates of the spatio-temporal variations of total terrestrial water storage for the first time (the sum of ground water, soil water, surface water, and snow pack) at seasonal and basin scales.
Surface water extent and its variations can also be measured with a variety of remote sensing techniques employing visible, infrared, or microwave observations. The following non-exhaustive list of techniques offer varying degrees of success regarding the diverse applications they are developed for. For instance, Synthetic Aperture Radars (SARs) show very large capabilities to measure surface water extent. Studies in the Amazon basin or in the Congo prove the ability of SAR to delineate accurately the surface water in tropical forest environments with high spatial sampling intervals (100m). However large data volumes have limited these studies to a few samples of a few basins preventing systematic, long-term assessments of inundation dynamics. Estimations of surface water extent using visible or infrared measurements provide relatively high-spatial resolution but cannot detect the surface water beneath clouds or dense vegetation. Other active microwave instruments such as the dual-frequency Topex-Poseidon radar altimeter are also valuable for detecting inundations, but because of their narrow surface track, the estimation of water body extent is limited to polar regions where their polar orbit yields better spatial coverage. Passive microwave observations have long been shown to detect surface water extents. However, most studies have been dedicated to specific areas like the Amazon basin or the Arctic regions. In addition, the microwave signal can be contaminated by the atmosphere (water vapor), clouds and rain, modulated by surface temperature, or altered by the presence of vegetation in open water / vegetation mixed scenes. These factors can distort time series estimates of surface water variations. These considerations lead to the conclusion that there is not a unique and exclusive technique to detect open water regardless of the environment. A multi-satellite technique is needed for the retrieval of surface water extent and dynamics at global scale. Combining observations from different instruments makes it possible to capitalize on their complementary strengths, to extract maximum information about inundation characteristics, and to minimize problems related to analysis of measurements by one instrument only.
In this context, a globally applicable remote-sensing technique employing a suite of complementary satellite observations has been developed to estimate spatial and temporal dynamics of surface water extent. This dataset is generated from several satellite instrument types: passive microwave (SSM/I), scatterometer (ERS), and visible and near-IR (AVHRR). The first results were obtained for one year [Prigent et al., 2001a]. Prigent et al. [2007] present the results over 8 years (1993-2000) and monthly results of spatial and temporal dynamics of inundations are analyzed and evaluated for different environments by comparison with in situ measurements and other related remote sensing observations. The method was carefully studied over the Indian subcontinent, [Papa et al., 2006b], over boreal environments [Papa et al., 2007; 2008a] and worldwide major ribver basins [Papa et al, 2008b]. This dataset has been recently used for climatological and hydrological analyses (see applications below).
The Dataset
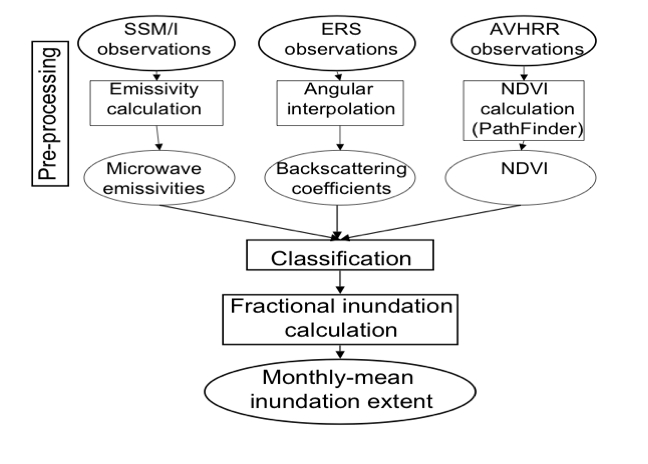
The complete methodology which captures at the global scale the extent of episodic and seasonal inundations, wetlands, rivers, lakes and irrigated agriculture is described in detail in Prigent et al. 2007 and Papa et al., 2006. The flowchart in Figure 1 summarizes the different steps of the technique. The algorithm uses a complementary suite of satellite observations covering a large wavelength range:
1) Advanced Very High Resolution Radiometer (AVHRR) visible (0.58-0.68m) and near-infrared (0.73-1.1m) reflectances and the derived Normalized Difference Vegetation Index (NDVI);
2) passive microwave emissivities between 19 and 85 GHz estimated from the Special Sensor Microwave/ Imager (SSM/I) observations by removing the contributions of the atmosphere (water vapor, clouds, rain) and the modulation by the surface temperature, using ancillary data from visible and infra-red satellite observations from the International Satellite Cloud Climatology Project (ISCCP) and the National Center for Environment Prediction (NCEP) reanalysis;
3) backscatter at 5.25 GHz from the European Remote Sensing (ERS) satellite scatterometer.
Observations are averaged over each month and mapped to an equal area grid of 0.25° resolution at the equator (~25 km interval, each pixel equals 773 km2). An unsupervised classification of the three sources of satellite data is performed and the pixels with satellite signatures likely related to inundation are retained. For each inundated pixel, the monthly fractional coverage by open water is obtained using the passive microwave signal and a linear mixture model with end-members calibrated with scatterometer observations to account for the effects of vegetation cover. As the microwave measurements are also sensitive to the snow cover, snow and ice masks are used to edit the results and avoid any confusion with snow-covered pixels (NSIDC mask). The technique is globally applicable without any tuning for individual environments.
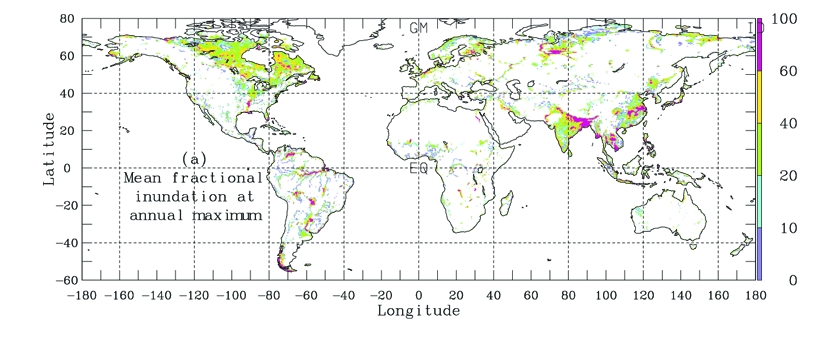
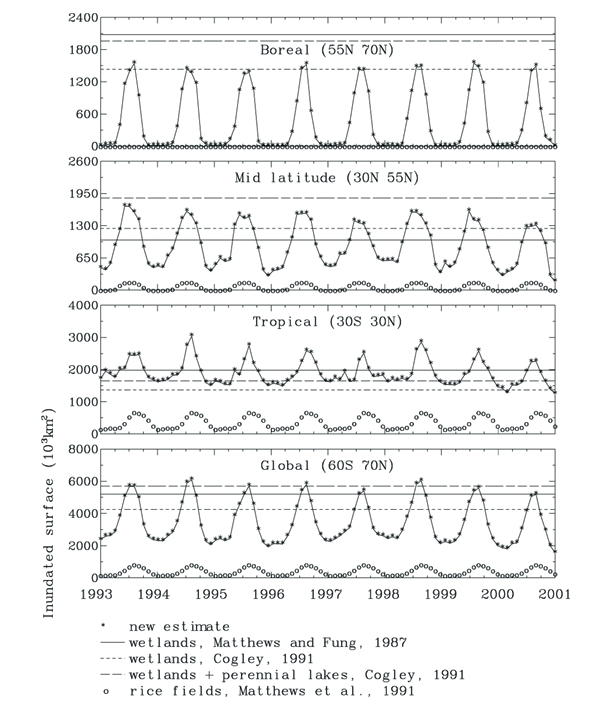
To illustrate the dataset, Figure 2 displays the annual maximum fractional inundation at global scale (averaged over the 8 years 19932000 period with a 773 km spatial resolution (i.e., equal area grid of 0.25x0.25 at the equator). Figure 3 shows the seasonal variations of the inundated areas globally and by latitude zones over the 1993 2000 period (Estimates from Matthews et al. [1987, 1991] and Cogley [2003] are also indicated.)
The product was first available from 1993 to 2000. ERS encountered technical problems in 2001 and the processing scheme had to be adapted to extend the time series beyond 2001. The adjustments of the methodology are discussed in Papa et al., 2008c and the data set is now extended using ERS and AVHRR mean-monthly climatologies. At this time of writing, the dataset of surface water extent is available on a monthly basis for the period 1993-2004 (but only available to the public for the moment for 1993-2000).
Example of Applications
The dataset is used now in various studies and projects, from methane studies to hydrology studies. The references of some studies are given below.
The surface water extent dataset is used for instance for the evaluation of the methane surface emission models. The dataset was used in the study by Bousquet et al. published in Nature in September 2006.
The surface water extent dataset is used for instance for the validation of the river flooding scheme in land surface models [Decharme et al., 2007].
The combination of the inundation estimates with altimetry-derived height level measurements of river and floodplains are a powerful tool to estimate the water volume changes in river basins [Papa et al., 2008b, Frappart et al., 2008]. This technique combines with measurements from GRACE and future missions dedicated to soil moisture will help to partitionate precipitations at the land surface and improve our knowledge of the water cycle.
The dataset has been used in a variety of hydrology studies over different environments. Papa et al. [2007] evaluated the consistency of the spatial and temporal variations of this inundation dataset over the Ob River basin using in situ snow depth and river runoff and Papa et al. [2008a] investigated the response of river discharge to seasonal flood change in the large Siberian watersheds.
The data are gridded on an equal area grid of 0.25x0.25 at the equator. Each grid is 773km in surface. The file contains the inundated surface for each month for 8 years (1993-2000) for each pixel on the globe. Land pixels with snow or ice are set to -1. Non-inundated pixels are set to -9, as well as ocean and coastal pixels.
To Download the data click Here
To Download the documentation and a list of the publications directly related to the dataset (as of December 2008) click Here
References
- Prigent, C., E. Matthews, F. Aires, and W. B. Rossow (2001), Remote sensing of global wetland dynamics with multiple satellite data sets, Geophys. Res. Let., 28 , 4631-4634, 2001.
- Papa, F., C. Prigent, F. Durand, and W.B. Rossow (2006), Wetland dynamics using a suite of satellite observations: A case study of application and evaluation for the Indian Subcontinent, Geophys. Res. Lett., 33, L08401, doi:10.1029/2006GL025767.
- Papa, F.,C Prigent, W.B. Rossow, B. Legresy, and F. Remy (2006), Inundated wetland dynamics over boreal regions from remote sensing: The use of Topex-Poseidon dual-frequency radar altimeter observations, Int. J. Remote Sens., 27, 4847-4866, doi:10.1080/01431160600675887.
- Bousquet, P., P. Ciais, J.B. Miller, E.J. Dlugokencky, D.A. Hauglustaine, C. Prigent, G.R. Van der Werf, P. Peylin, E.G. Brunke, C. Carouge, R.L. Langenfelds, J Lathière, F. Papa, M. Ramonet, M. Schmidt, L.P. Steele, S.C. Tyler, and J. White (2006), Contribution of anthropogenic and natural sources to atmospheric methane variability, Nature, 443, 439-443, doi:10.1038/nature05132.
- Papa, F., C. Prigent, and W.B. Rossow (2007), Ob' River flood inundations from satellite observations: A relationship with winter snow parameters and river runoff., J. Geophys. Res., 112, D18103, doi:10.1029/2007JD008451.
- Prigent, C., F. Papa, F. Aires, W. B. Rossow, and E. Matthews (2007), Global inundation dynamics inferred from multiple satellite observations, J. Geophys. Res., 112, 1993-2000, D12107, doi:10.1029/2006JD007847.
- Papa, F., A. Güntner, F. Frappart, C. Prigent, and W.B. Rossow (2008): Variations of surface water extent and water storage in large river basins: A comparison of different global data sources. Geophys. Res. Lett., 35, L11401, doi:10.1029/2008GL033857.
- Papa, F., C. Prigent, and W.B. Rossow (2008): Monitoring flood and discharge variations in the large Siberian rivers From a multi-satellite technique. Surv. Geophys., doi:10.1007/s10712-008-9036-0
- Decharme, B., H. Douville, C. Prigent, F. Papa, and F. Aires (2008): A new river flooding scheme for global climate applications: Off-line validation over South America. J. Geophys. Res., 113, D11110, doi:10.1029/2007JD009376.
- Frappart, F., F. Papa, J.S. Famiglietti, C. Prigent, W.B. Rossow, and F. Seyler (2008), Interannual variations of river water storage from a multiple satellite approach: A case study for the Rio Negro River basin, J. Geophys. Res., 113, D21104, doi:10.1029/2007JD009438.
- Papa, F., C. Prigent, W.B. Rossow, and E. Matthews (2008): Interannual variability of surface water extent at global scale, 1993-2004. J. Geophys. Res., submitted.
- Ringeval B., N. Noblet-Ducoudré, P. Ciais, P. Bousquet, C. Prigent and F. Papa (2008), An attempt to quantify the impact of changes in wetland extent on methane emissions at the seasonal and interannual time scales, submitted to Global Biochemical Cycles
|